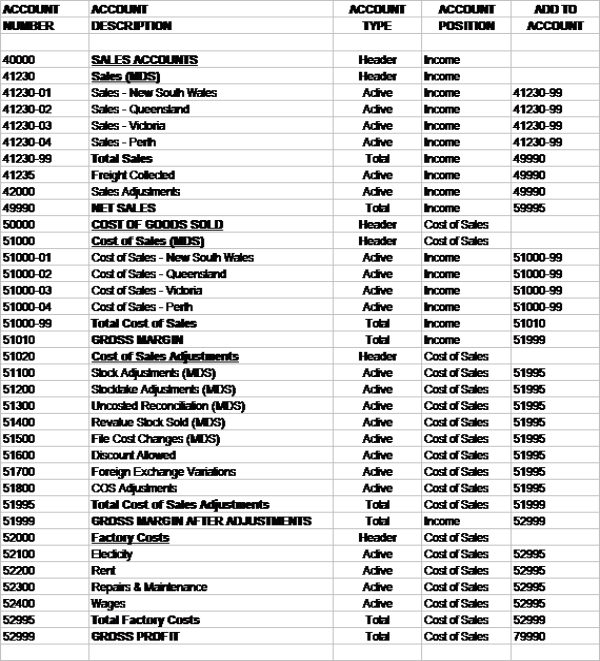
The simple Chart of Accounts can be extended for larger or more complex organisations.
Sales and Cost of Sales can be dissected in any number of ways, such as by product categories, sales territories, warehouses, etc. The calculation of various margins may also be a consideration, where Sales versus Cost of Sales reveals Gross Margin, and Gross Margin versus Direct Expenses, Factory Costs or Manufacturing Costs reveals Gross Profit. The calculation and compilation of these margins provides management with a very comprehensive and detailed analysis of the organisation's main source of income, the costs associated with earning that income and the resulting profits made before operating expenses.
Operating expenses may be another area where major dissections occur. Motor vehicles may need to be reported by vehicle and cost. Telephone costs may need to be split between various salespeople for analysis. Wages may need to be reported in various categories, such as by factory, sales or administration. All these considerations need to be made when implementing your Chart of Accounts.
However, the Balance Sheet section of the Chart of Accounts can be formulated in the same way as a simple Chart of Accounts. The Balance Sheet is a statutory requirement and the format used for smaller organisations will satisfy any private business.
The illustration below shows how Sales and Cost of Sales can be dissected for greater detail and analysis. In the example, Sales and Cost of Sales are dissected by warehouse. Integration configuration and tables need to be implemented within MDS to support this Chart of Accounts.

For information about setting up your Chart of Accounts, refer to "File - GL Accounts".